

6 innovative use cases of generative AI in contact centers
Generative AI is changing contact centers by adapting in real time and generating content on demand. Ready to turn AI into action across your contact ...
The Team at CallMiner
October 08, 2019

Share
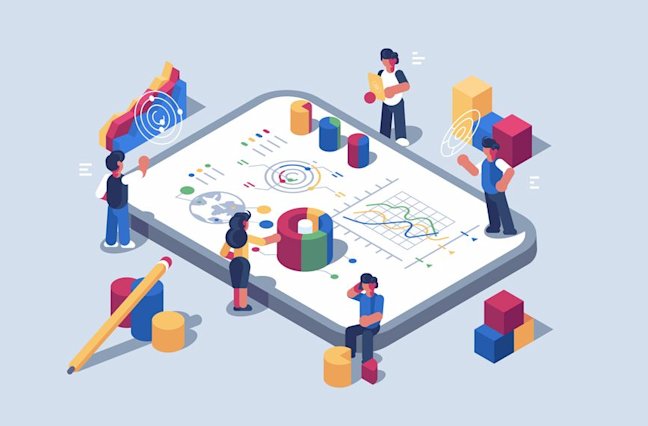
In today’s data-driven world, data analytics tools are more important than ever. Enabling businesses to analyze raw data from multiple data sources, identify correlations and trends, and even make predictions about the future, data is a key driver of strategic decision-making for companies of all sizes. Data analytics tools are more accessible today, as well, thanks to maturing technologies and data storage options that result in more affordable costs.
Companies generate a vast amount of data from a multitude of sources every day, yet much of that data remains in raw form, unused. Data can be both structured and unstructured and gathered from a variety of disparate sources such as social listening, surveys, your website, customer support (such as speech analytics to capture unsolicited customer feedback and measure customer sentiment), and even your voice and text interactions (including call center interactions, SMS messaging, live chat, and more). Given the growing number of data sources, it’s no surprise that there are a variety of types of data analysis tools, from customer experience analytics to speech analytics, web analytics, and even HR analytics solutions. For some companies, the options can be overwhelming and the buying decision a difficult one – particularly if they haven’t taken the time to identify their business needs and objectives.
We’ve put together this buying guide to help you find the best data analytics solution for your company’s needs, with expert tips to guide you through the process of understanding your user requirements, integration considerations, the importance of solid customer support services, and other considerations you should weigh before taking the plunge. Among the expert tips below, you’ll find valuable advice for choosing the right data analytics tools, as well as expert guidance for ensuring proper configuration and integration to get the most value from your investment – and from your data.
“Originally, business intelligence analytics tools fell to the skill sets of data analysts and BI specialists. They were trained to create and assess reports using data queries that produced specific data sets based on business demands and requirements. However, more business intelligence reporting tools are now user-friendly so that data discovery can be performed by any manager or employee. This approach is becoming known as ‘self-service’ BI.
“Business intelligence analytics tools can encompass a range of data techniques to fit different business needs. This can include drill-down enterprise reporting, both ad hoc and programmed queries, OLAP (online analytical processing), and the creation of various data cubes, hierarchies, filters, and perspectives.
“Reporting tools generally include data visualization, or the ability to present results in infographic formats like charts, maps, and diagrams. Often, BI is used to generate and sustain business dashboards which show selected key performance indicators or other metrics as easily understood graphics, for example dials or progress bars. But business intelligence analytics tools can also be used in conjunction with other applications such as CRM to provide added insights and value to customer service.” – Robert Cordray, Leveraging Data with Business Intelligence Analytics Tools, SmartDataCollective; Twitter: @SmartDataCo
“Even in the most user-friendly of data analysis programs, it’s common to encounter some technical difficulties. Be sure to evaluate all the training and support services a vendor offers before committing to their system. This may include 24/7 live chat, online case submissions, webinars and more.” – Data Analysis Tools, Software Advice; Twitter: @SoftwareAdvice
“The practical aspects of integrating a new technology into an organization must also be considered. Evaluating the simplicity of administration and configuration includes understanding any system requirements and dependencies for installation, configuration and ongoing management.
“For example, the big data analytics tools that take advantage of the statistical models in R require that the R environment is acquired and installed at the same time the products are installed. This also includes identifying the platforms on which the product may be installed, as well as determining the platforms that can embed the developed models and applications.
“Other considerations include the security associated with the designation of roles and access rights for both the analytics process and the incorporation of developed models into business applications. Explore what options the products provide for authentication, authorization and access control.” – David Loshin, Insights into buying big data analytics tools, TechTarget SearchBusinessAnalytics; Twitter: @BizAnalyticsTT
“Taking scalability into account can sometimes come at odds with selecting the best tool for your situation right now. However, this is an important (and often overlooked) aspect of selecting data analytics and BI software. Of course, you’ll want a solution that can handle your current load, but what if the tool can handle only your current load and nothing more? That’s when it may be time to look at other alternatives, or perhaps consider an infinitely scalable cloud BI option.
“Your needs may not change much over time, but the flexibility that comes with a more scalable analytics tool can be invaluable should demands arise. Things to consider when we talk about scalability include data volumes, depth of analysis, the number of users you are trying to support, and if you are interested in a cloud-centric product, licenses and costs associated with them.” – Timothy King, 5 Best Practices for Selecting Data Analytics and BI Software, Solutions Review; Twitter: @BigData_Review
“Also keep in mind the needs of other people who will use the software. If technicians will use the software to analyze SPC data, you must find software with easy-to-understand menu choices as well as with graphs and charts appear that are easy to view and print. If other engineers will use the data-analysis software, you will need software that can quickly switch between various setups.” – Jon Titus, 10 Questions You Must Ask Before Buying Data-Analysis Software, EDN Network; Twitter: @EDNcom
“The BI market is a relatively mature one and differences in functionality, performance and usability between the various BI solutions are now less marked than they were a few years ago. Also, the principal market players now have plenty of experience in delivering professional, impressive proofs of concept. As a consequence of these factors, we see price taking on extra significance as a differentiator.
“‘Ease of use for end users’ and ‘ease of use for report designers’ remain popular selection criteria. The increasing demand for ease of use has coincided with the rising trend for ‘self-service BI’ over recent years, with its focus on enabling business and IT users to flexibly adjust applications without requiring the help of specially trained individuals. Self-service is a common requirement for BI projects as organizations attempt to increase agility by empowering users and lessening the burden on IT departments.” – What Are the Right Criteria for Choosing BI Software?, BI-Survey.com; Twitter: @barc_research
“About 90 percent of software life cost is related to its maintenance phase, according to one report. Relying on open source analytics components means that, if one component is updated or breaks, the whole solution may fall apart, rendering your application unusable until it is fixed.
“Software companies that choose to build a solution with open source analytics commit to staffing significant resources in development, support, and keeping up with advances in data visualizations and business intelligence over the long term. Since open source analytics tools and free data visualization tools are constantly evolving, the upkeep of each analytics component adds to the overall investment.
“So, when does it make sense to build a solution with open source analytics tools? If BI is part of your company’s core competency, then you should definitely build. Also consider this route if your users’ needs will always be limited in scale (for instance, if all they need is a static dashboard and reporting that you have no plans to charge more for).” – Michelle Gardner, 4 Hidden Costs of Open Source Analytics Tools, Logi Analytics; Twitter: @LogiAnalytics
“Once you have narrowed down your consideration set to a few candidates, then experiment with each before committing (i.e., purchasing) licenses or long-term contracts. Most vendors offer free trials, so take advantage of those! Use a familiar dataset to explore how asking questions of your data works within the software. Try out different visualizations, reports, dashboards to assess your comfort level with the user interface. Validate your assessment from the checklist to meet (or exceed!) expectations.
“Make sure you have an ‘evangelist’ or ‘advocate’ internally, someone who is passionate about the solution and adoption within the company. If you don’t have a person or team who is passionate about the solution you will find your BI software is just as productive as a gym membership 4 weeks after the New Year’s resolution that prompted it.” – Thomas Spicer, How To Select Data Analytics and Business Intelligence Tools, Openbridge; Twitter: @openbridgeinc
“Enterprise web analytics usually has to function as a part of a bigger digital set-up. Therefore, it’s essential to ensure that your chosen platform can integrate with the tools you already use. Another thing is steering away from vendor lock-in, that is, making sure even if for some reason you need to change your tool, you’ll still be able to migrate your data easily, without losing any of your history.
“Visualization is the final and often overlooked stage of the big data analytics process before insights are transformed into action. Visualization can be achieved in generic software like Excel but specialised solutions have emerged for businesses which want to make sure their analytics strategy is clearly communicated to all relevant stakeholders. Some of the key vendors here include Tableau, Datawatch, SAS and Qlik.” – Bernard Marr, How To Find The Best Big Data Product Or Service Vendors?, Forbes; Twitter: @BernardMarr, @Forbes
“Even though the quantum of data generated has increased exorbitantly, and data is the bedrock of analytics and informed decision-making, analytics is not, ironically about more data but about making better sense of the data available, albeit at scale.
“So, let’s say you have decided you need predictive and you also meet the basic criteria for deploying it. You call on several vendors and in every meeting, there is an elephant in the room that no one wants to deal with… no, it’s not your data, it’s the quality of your data.
“While having a stable CRM and MAP or ABM platform in place is a prerequisite to deploying advanced analytics, if the quality of data inside those systems is not so great, I don’t have to spell out what the results of predictive will be. The data has to be usable, current and actionable. It’s a sensitive topic because no one wants to admit that their million-dollar system is full of junk. Or, blame anyone who is responsible for putting the junk in there (especially if they are themselves to blame). Another reason could be that CRM is typically a sales-owned system, and this evaluation is being led by marketing, who may not want to get confrontational about it and are also under pressure to deliver results. If this was FB, I’d be really tempted to say, ‘It’s complicated.’ Oops, I just did.” – Chitra Iyer, Predictive Analytics for Right-Brained Marketers, MarTech Advisor; Twitter: @MoreMarInTech, @MarTechAdvisor
“Starting with a sea of data can be overwhelming. The best approach is to identify the business need and select up to three of the most requested use cases across the organization that most closely meet your business objectives.
“Use cases might include optimizing marketing promotions, optimizing sales leads or improving the quality of customer service.
“’For example, if your desired outcome is to increase or avoid losing revenue and your business discipline is customer service, select a relevant use case such as ‘reduce customer churn’,’ says Davis. ‘Next, identify the types of data to acquire, such as the customer’s interaction history (purchases and call center interactions) and profile data. Finally, select the analytics to apply.’” – Melissa Davis, research director at Gartner, as quoted by Susan Moore, 3 Steps to Get the Most from Customer Data, Gartner; Twitter: @Gartner_inc
“The difference between ‘big data’ and useful data is having the right tools to analyze data. In an era when almost every department is flooded with information about clients, prospects, processes, and operations, effective data analysis can easily become a source of competitive advantage.
“Business intelligence (BI) software aids this process by pulling data from your various client-side and back-end systems and providing visualization and analysis tools. By transforming your raw data into intelligible reports, dashboards, and illustrations, you can gain quicker insights, make better decisions about your business, and move toward positive revenue goals faster.” – Aleks Peterson, Domo vs. Tableau: Choosing the Right Business Intelligence Solution, TechnologyAdvice; Twitter: @Technology_Adv
“While data might seem like just a collection of numbers, all you have to do to change that is to turn it into a story. If your data has a beginning, middle, and end, you can persuade people to see things in a new way. Rather than being hammered with information, people will be engaged with your narrative.
“First, tell them what happened. Then, get them to understand why your data is important to what happened. Lastly, they need to know how they can turn that data into something actionable.
“When they understand their role in this story, they’re more likely to be invested in what’s happening with your data. Using data visualization allows you to draw everyone into the story in more creative ways. You can show patterns, draw conclusions, or prove theories that help to inform the way that decisions are made in your company.” – 5 Essential Tips for Creative Storytelling Through Data Visualization, Boost Labs; Twitter: @boostlabscom
“If you worry about staying current with big data technology, you’re not alone. Everything is evolving so fast that it’s impossible to know which tools, platforms, and methodologies will be best this year or next.
“Relax. This rapid evolution can work for you.
“Every year, vendors will get better and better at using big data. Relational and online transactions systems (OLTP) will become more efficient and smarter, whether running on-premise or on the cloud. Techniques will develop to ease relations between Hadoop and data warehouses. And all the time, products will come to market to meet your particular needs ever more exactly.
“So stay loose. Stay open to the possibilities of new products, as long as they deliver enough value to justify bringing them into your existing environment. Maintain a business intelligence platform that directly connects to a wide variety of formats. You’re now ready for anything the market can provide.” – 7 Tips to Succeed with Big Data, Tableau; Twitter: @tableau
“Business intelligence combines disparate data sources into one database by building a data warehouse. Data warehouses act as a central repository for data to be queried and analyzed by other BI applications. Using the extract, transform, and load method, data warehouses aggregate data from across an organization and make it easier for other applications to quickly access them.
“Analytics and reporting tools can still function without data warehouses, but running reports through CRM software, or even point of sale (POS) software not only limits the focus of the intelligence, it also negatively affects the performance of those applications. Also, the data in these systems exist in different formats, making it exceptionally difficult to draw conclusions and identify patterns without restructuring the data into a common format and housing it in a common area.
“Data stored in a data warehouse takes the form of dimensions or facts, which are pulled from the systems that produce the data. Facts represent numbers for a specific action, like the sales of a widget. Dimensions give context to facts by adding dates and locations, and is also called metadata. For instance, dimensions could break apart the sales of a widget by months or years, making queries easier to perform.” – TechnologyAdvice Guide to Business Intelligence Software, TechnologyAdvice; Twitter: @Technology_Adv
“How often have you looked at your Amazon recommendations and thought, ‘Wow, I could really use that!’ Chances are, that reaction happens fairly often considering that Amazon uses big data to figure out exactly the type of products you’ll want to buy in the future.
“The retail giant – which hit a net worth of 1 trillion dollars late in 2018 – gives its customers insight as to what factors go into determining those recommended products. In this context, Amazon cites a variety of data points to figure out what its customers want. Those factors include:
“Obviously, the last factor is the most important one as pertains to big data. Amazon is able to correctly determine what kind of products you want to buy based on customers with buying habits similar to yours.
“Similarly, you can use this kind of data to make predictions for your own customers. When you see a sales increase, you’ll start to notice trends. For example, Amazon noticed that people who buy TVs tend to also purchase a TV mount – which the retailer began to upsell in the hope that customers would buy them together.” – Syed Balkhi, How Companies Are Using Big Data to Boost Sales, and How You Can Do the Same, Entrepreneur; Twitter: @syedbalkhi, @Entrepreneur
“The need for quick results always balances with the need for higher data quality, accuracy, and reliability in all regards. Management of quality and ethical data sourcing, entry, and retrieval combined with continual quality testing and improvement lead to increased value for organizations.“Driving the Data Quality and Data Governance advancement, is an emerging need for center of excellences around analytics and data. Included in this is the evolution of the need for Chief Data Officers and Chief Analytics Officers within many organizations. Along with the quality assurance, there is a necessarily growing demand for added security as privacy threats and public concern grow. Here, Data Quality and Governance play one of the main pillars of achieving democratized data access within organizations.” – Steve Kerr, The 5 Most Significant Analytics Trends for 2017, Chicago Analytics Group; Twitter: @ChicagoAGroup
“Integration of big data technology and services with traditional business intelligence is seen as the way forward for businesses focusing on quick fact-based decision making and improvement in customer experience.
“Business intelligence has been a reliable tool for companies to understand their target audience more intimately; however, the high turnaround time has remained an impediment. The incorporation of big data has mitigated this challenge to an extent, which in turn has fueled adoption among end-users. In the future, it is highly likely that big data and business intelligence will become highly intertwined.” – Ilker Koksal, Data Driven Decision Making Fueling Big Data Adoption, Forbes; Twitter: @ilkerkoksal, @Forbes
“The massive amount of personalised information being pushed out by mankind is a huge opportunity to spot, sort and commercialise on the patterns applicable to your business. Whether it is analyzing billions of transactions to detect fraud (risk management) or forecast/predict consumer behaviour to plan for growth via customer acquisition/retention or development, you need more than just a cool data platform. You need a solid team and a big data management plan.
“To build and run successful big data teams and projects you need data scientists within your teams. Big data is not just about Hadoop or some cool new technology, it is about doing the ‘what-if’ before your competitor does. And then move on to the next ‘what-if.’
“Instead of only focusing on using a consistent set of data to measure past performance and report for business planning, businesses must also focus on a combination of analytics and machine learning techniques so they can draw inferences and insights out of the massive sea of data. This will help you solve the higher order questions and derive far greater business value that you could have ever imagined!” – Tarry Singh, Why Data Scientists Are Crucial For AI Transformation, Forbes; Twitter: @tarrysingh, @Forbes
“What big data and analytics strategies can business managers use to break down functional silos in the company?
“Evaluate your big data assets
“Companies still struggle with sorting out through all of the big data that they are storing. Until they get the bottom of the data that they have under management, they will not know the data they have and all of the ways that they can possibly use it. Now is the time to inventory your various data sources and the data they contain so you can determine the data stores that are still untapped but that could bring new value.
“Challenge departments to develop and share responsibility for the same objectives
“When different company departments work together on the same objective, they gain greater insights into how they can help each other, the quality of their big data queries, and the company overall. If the objective is to retain customers and build revenues from these customers, sales can be selling and service can be tipping sales about which customers are happy and which aren’t before the calls are made. Meanwhile, marketing can be learning from sales about which products customers like best, and what future product enhancements customers would like to see.
“Develop new algorithms and queries that deliver actionable insights
“If customer sentiments over social media aren’t matching recent sales results, there could be product flaws or brand perceptions that customers are struggling with but that the sales force is unaware of. Unfortunately, sales is unlikely to get a heads up about this unless someone is marrying unstructured social media sentiment data with transactional sales history on customers in various demographics.
“This is where collaboration between marketing, sales and service really pays off because departments can pool their knowledge so they can come up with insightful questions of their big data that reveal breakthrough information. For instance, instead of asking which areas products are selling the best in, companies could also be asking if their customers are satisfied with recent purchases. They could then bend the answers from both questions to come up with insights into whom of their existing customers is likely to reorder and when.” – Mary Shacklett, How big data can break down silos and inspire collaboration within your company, TechRepublic; Twitter: @MaryShacklett, @TechRepublic
“The top three barriers for creating a single source of customer intelligence are: 1. operational silos, 2. lack of systems or data standardization or integration, and 3. data quality issues.
“In my experience as a chief customer office and chief marketing officer, the biggest barrier is leadership’s understanding of the importance of clean, usable data. In the age of artificial intelligence, where algorithms are developed to augment and accelerate organizational efficiency and effectiveness, the quality of data is of critical importance. Business leaders must articulate the importance of data quality, and collaborate with IT and other lines-of-business in order to develop an insight driven culture with share visibility and opportunities for co-creation of value.” – Vala Afshar, Advanced Predictive Analytics and AI Will Close The Customer Experience Gap, Huffington Post; Twitter: @ValaAfshar, @HuffPost
“Though the quality and quantity of data from buyers’ digital interactions is rising, companies clearly haven’t done enough to invest in it. It’s imperative that in a competitive world, companies should not miss an opportunity to know buyer preferences. Modern business thrives, and will survive, on its capacity to conduct a digital dialogue with all stakeholders, especially customers. In the digital world, companies listen with data and respond through a variety of digital interactions, especially customers. In the digital world, companies listen with data and respond through a variety of digital interactions, especially social media. It’s well established that modern marketers should understand the importance of data, but not enough importance has been assigned to the role of predictive analytics.
“It is specifically in predictive analytics that marketing should make headway, not only for ROI but also other priorities such as staying ahead of the competition. Research shows that businesses should typically start with data from interactive systems such as click streams, video views, or search. Businesses of today have more than 40 categories of interaction technology to utilize. By incorporating data from other systems like CRM, logistics, and finance, you can stay well ahead of the pack.” – Deepak Wadhawan, Predictive Analytics: Why it is the Smart Science for Smarter Business, Economic Times; Twitter: @EconomicTimes
“Part of the fear of AI stems from its perceived ‘black box’ inscrutability. That is why it is so important to employ technologies that present automated discovery as natural language explanations of why something is happening and why a given prediction is important. AI may predict a number, but that number on its own is useless. Lasting value is derived when that number is accompanied by a natural language explanation that allows the business user to understand why the model arrived at that number.“Business people are not alone in this. Data scientists, compliance experts, and other technologists need their own explanations in the form of the code for the model that delivers the prediction. Such transparency enables them to validate the model and is the best way to engender trust.” – Vala Afshar, 8 ways to effectively advocate for AI, ZDNet; Twitter: @ValaAfshar, @ZDNet
“As the researcher, it’s your job to turn data into information and then to turn information into insights. Just sharing data is only halfway.
“When you share your findings, don’t present the data. Don’t even present the information from the data. You want to present the insights that come from your information. Insights go beyond just sharing percentages and data breakouts.
“Insights come when you apply knowledge and ideas to the data in the survey. Insights may take the form of a recommended action, or examining how two different data points are connected. An insight combines the science of the data with the art of the mind.
“You will always get better feedback from your team if you do the hard work of finding insights to share instead of just showing them the data and waiting for them to make insights.” – 5 Best Practices of Survey Analysis & Our Favorite Tools, Qualtrics; Twitter: @Qualtrics
What’s your top buying consideration when selecting data analytics tools?

