


Whitepaper
Why CallMiner?
See how we help you translate customer insights into business value.
Learn More
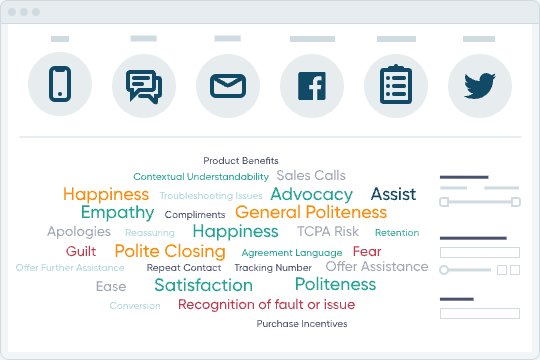
CallMiner Visualize enables organizations to visually explore conversation analytics data, create sharable presentations that demand attention and encourage action within and beyond the contact center. An upgrade component for CallMiner Analyze, Visualize leverages data to tell your story of customer interactions.
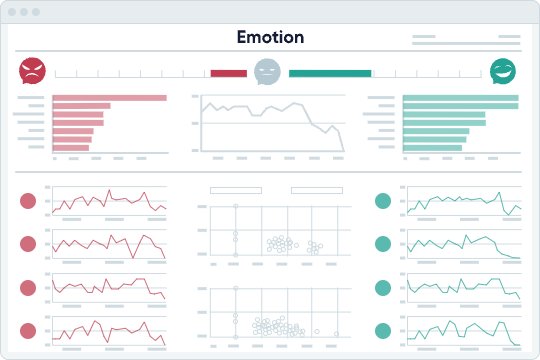
Enhance audio evidence with graphical presentation that is easy to customize and annotate based on key points of interest.
Drill-down details reveal insights based on customer behaviors, agent performance, process challenges and other root cause indicators.
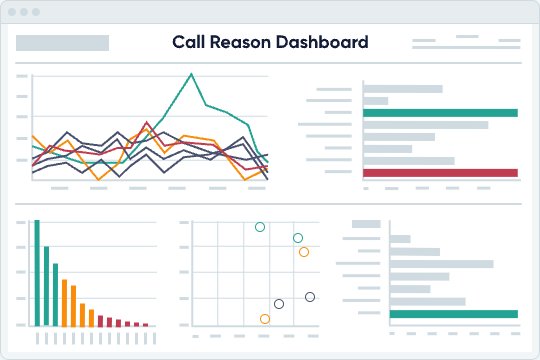
Create graphics that can be understood organization-wide, from contact center to C-Suite, to spread impact.
CallMiner Visualize is powered by Tableau, the market-leading choice for modern business intelligence. Together, our technologies create the most powerful tool for visual storytelling with conversation analytics.
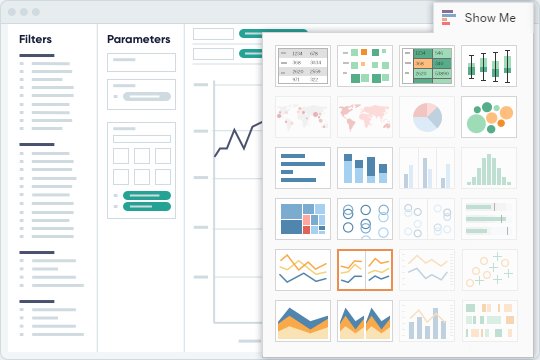
Customize how data displays, telling the story from various angles for insight into any business scenario.
See how peformances rank across the team or between individual agents to find out what drives success.
Understand the big picture even as that picture grows, modeling your success in simple infographics no matter how large your organization gets.
We saw opportunities right out of the gate. CallMiner helped us visualize the impact of COVID-19 on our call drivers, allowing us to make changes to our IVR system so that customers could leave a voicemail to cancel trips. While other companies had hold times during the initial outbreak from five to 10 hours, we were able to reduce hold times to about seven minutes. Much of this success was due to the insights gleaned from CallMiner.
Director of Operations, Gant Travel

