


Your contact center is sitting on a goldmine of customer insight. Are you using it?
Discover how to unlock hidden insights from customer conversations to improve CX, reduce churn, strengthen agent performance, and drive better decisio...
Share
Here’s an outline for using PCA for ranking feature importance and doing an “A/B” test. See here for an introduction to PCA via matrix factorizations.
PCA gives us a way to reorganize a matrix (or in this case, a data set of examples as rows and features as columns) as a sum of approximations such that
Usually, we assume that the approximations that have the largest contributions are also the most important. So PCA will not only create a smaller number of derived features (potentially helping with overfitting) but those derived features can reveal feature importance.†
So let’s say you have some labeled data that has two categories, the A-set and the B-set.
Answering number 2 first: if you choose enough components for PCA, you should be able to explain enough of the variance in the data set. For example, with the Encore data set I’ve been looking at, only 30 columns are required to explain over 90% of the variance. You can then feed this approximation to your classifier of choice for good accuracy too; I got > 90% wit a gradient boosted tree.
Now for number 1. Here’s what PCA gets us. The image below shows four “color columns” / features of data.
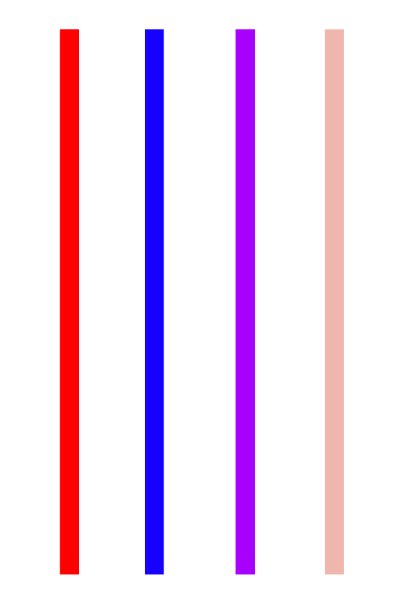
That’s 4 columns. Way too many. With PCA, we can choose an approximation with, say, 2 columns:
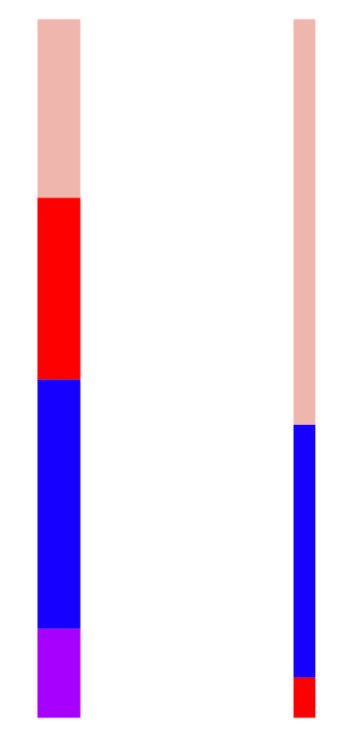
The left column is “wider” because it is the first component of PCA, and the first component is the most important. We can see the blue feature makes up the largest part of the first component. The other column is the second component of PCA. It is not as important as the first (meaning it contributes less to the original matrix / data set), but within it, the beige feature is the most important part.
To try to get a sense of feature distinction between A and B, I did the following:


So now I have two histograms. Do I have look at every feature paired up this way? Well, no. Besides looking at them, there are at least three ways of judging how similar two histograms are:
However we define the similarity, once we have it, we can set a threshold over which we can declare the histograms different.
Once we have a feature that is both important (from a low PCA component number) as well as distinguishing (histogram similarity is low), it should be worth having a client or BIA examine it.
†Whenever you see DataRobot mention that PCA is used as part of its pipeline, it’s most likely doing both dimensionality reduction as well as contributing to feature importance.


